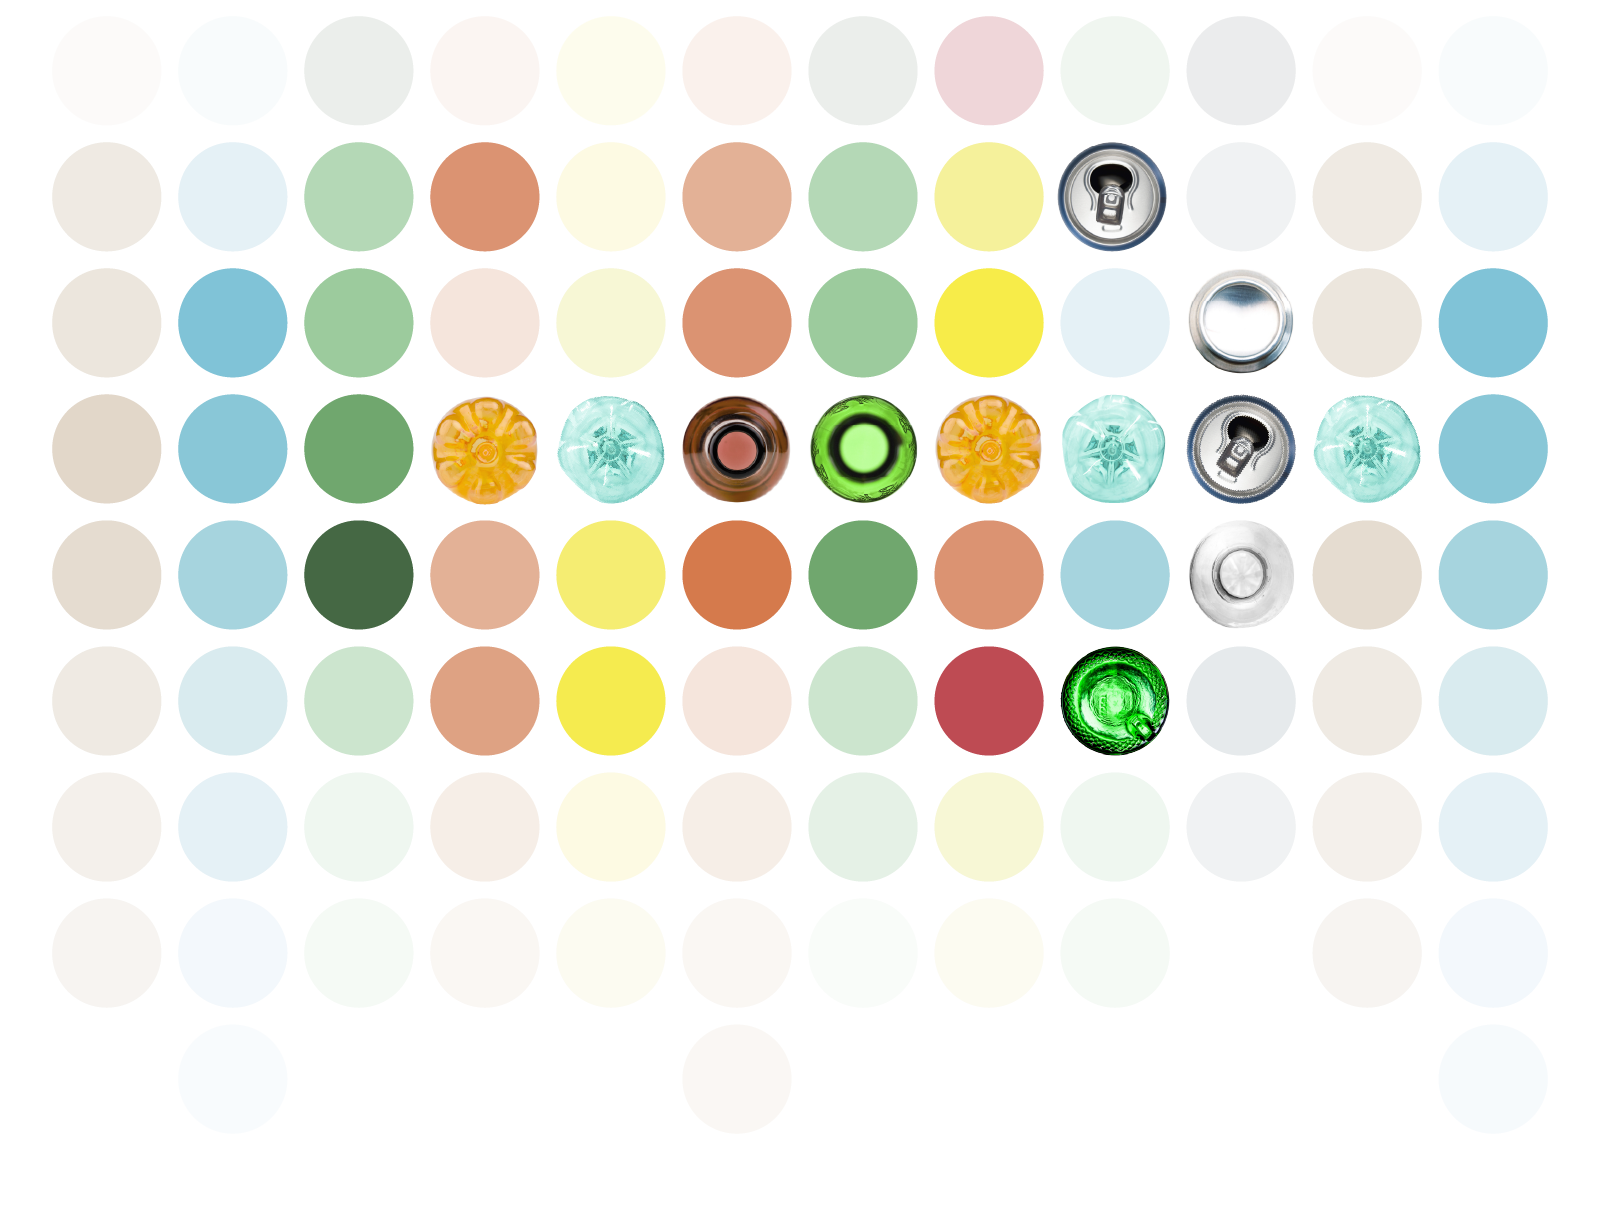
What We Waste
Now drawing on expanded data from 210 countries to examine trends in sales, collection and wastage of drinks containers.
Reloop’s updated Dashboard allows users to explore a wide range of insights into beverage container use and waste, examining trends in sales and collection.

Expanded data for 2025
This update draws from an expanded data set of 210 countries/territories, covering roughly 98.5% of the global population and for the first time includes wine, spirits, and flavoured alcohol.
The dataset also includes sales projections up to 2029. This means our dashboard can utilise projected “collection for recycling” rates to estimate what we will waste in the next five years.

New ways to filter and simulate data
Our new metrics allow you to estimate the volume, monetary value, and carbon emissions impact of those wasted tonnes/tons. You can also explore the potential positive impact of introducing a deposit return system in 2025 through a realistic simulation.

What does Reloop mean by waste?
Throughout this dashboard, wastage is defined as containers ending up in landfill, incineration, or in the environment. This waste figure is determined by the ‘collection for recycling rate’ which is a number that is available by material in over 50 of our 210 countries/territories and is measured in units and tonnes/tons, and can be calculated by country and package material.
Latest updates and how to contribute
We regularly update and expand our data to keep the board as accurate and up-to-date as possible. New insights are routinely integrated, so check back often for the latest updates.
Updates are reflected in the “Changes” section.
If you have additional data to contribute, please email Jason Wilcox
Related
-

Explore Reloop’s What We Waste Dashboard
In this recorded session Jason Wilcox, Reloop’s Data and Dashboard Manager, introduces the updated What We Waste Dashboard.
-
What We Waste
Report tracking 20 years of growth in international drinks container wastage.
Our Global Deposit Book offers comprehensive overview of Deposit Return Systems for Single-Use Beverage Containers.
The European Union Packaging and Packaging Waste Regulation (PPWR) is an agreement aimed at reducing pollution from packaging materials.

Reloop’s work on the UN’s global plastics treaty to reduce plastic pollution.

Reloop Programme 1
Meaningful Measurement
What We Waste is in line with Reloop’s programme for packaging measurable via fully transparent and accurate data.